-
Big-O matters, but it's often memory that's killing your performance.
We spend so much time drilling algorithmic complexity. Big-O and all that. But performance is so often about contention and memory, especially when working in parallel.
I was just working on a program that does Monte Carlo simulation. That means running the same algorithm over the same data thousands of times, with some amount of injected randomness. My single-threaded approach was taking 40 seconds, and I wanted to make it faster. Make is parallel!
I tried all kinds of scaling factors, and unsurprisingly the best was 8-way on a 10-core system. It got me down to…50 seconds?!?!? Yes, slower. Slower? Yes. Time to pull out Instruments.
My first mistake was trying to make it parallel before I pulled out Instruments. Always start by profiling. Do not make systems parallel before you’ve optimized them serially. Sure enough, the biggest bottleneck was random number generation. I’d already switched from the very slow default PRNG to the faster GKLinearCongruentialRandomSource. The default is wisely secure, but slow. The GameKit PRNGs are much faster, but more predictible. For Monte Carlo simulation, security is not a concern, so a faster PRNG is preferable. But it was still too slow.
Why? Locking. GKLinearCongruentialRandomSource has internal mutable state, and is also thread-safe. That combination means locks. And locks take time, especially in my system that generates tens of millions of random values, so there is a lot of contention.
Solution: make the PRNG a parameter and pass it in. That way each parallel task gets its own PRNG and there’s no contention. At the same time, I switched to a hand-written version of xoshiro256+ which is specifically designed for generating random floating-point numbers. Hand-writing my own meant that I know what it does and can manage locking. (I actually used a struct that’s passed
inoutrather than locking. I may test out a class + OSAllocatedUnfairLock to see which is faster.)Anyway, that got it down to 30s (with 8-way parallelism), but still far too slow. Using 8 cores to save 25% is not much of a win. More Instruments. Huge amounts of time were spent in retain/release. Since there are no classes in this program, that might surprise you, but copy-on-write is implemented with internal classes, and that means ARC, and ARC means locks, and highly contended locks are the enemy of parallelism.
It took a while to track down, but the problem was roughly this:
portfolio.update(using: bigObjectThatIncludesPortfolio)bigObjectincludes some arrays (thus COW and retain/release) and includes the object that is being updated. Everything is a struct, so there’s definitely going to be a copy here as well. I rewroteupdateand all the other methods to take two integer parameters rather than one object parameter and cut my time down to 9 seconds.Total so far from cleaning up memory and locks: >75% improvement.
Heaviest remaining stack trace that I’m digging into now:
swift_allocObject. It’s always memory… -
Pull Requests are a story
I’ve been thinking a lot about how to make PRs work better for teams, and a lot of my thinking has gone into how to show more compassion for the reviewer. Tell them your story. What was the problem? What did you do to improve it? How do you know it is a working solution (what testing did you do)? Why do you believe it is the right solution? Why this way rather than all the other ways it might be solved?
Code does not speak for itself. Even the most clear and readable code does not explain why it is necessary, why you are writing it now. Code does not explain why it is sufficient. The problem it solves lives outside the program. The constraints that shape a program can only be inferred. They are not in the code itself. When we want others to review our coding choices, we have to explain with words. We have to tell our reviewers a story.
And that brings me to the most important writing advice I’ve ever been taught. If you want to write well, you must read what you wrote. There’s an old saying that writing is rewriting, but hidden in that adage is that rewriting is first re-reading.
The same is true of PRs and code review. Before you ask another person to review your code, review it yourself. See it on the screen the same way they will. Notice that commented-out block and the accidental whitespace change. Is refactoring obscuring logic changes? If you were the reviewer, what kinds of testing (manual or automated; this isn’t a post about unit testing) would make you comfortable with this change?
Maybe you need to do the hard work of reorganizing your commits (and checking that your new code is precisely the same as your old code!). But maybe you just need to explain things a bit more in the PR description. Maybe a code-walkthrough is needed. Or maybe it really is an obvious change, and your reviewer will understand at once. There’s no need to over-do it. Let compassion and empathy lead you, not dogmatic rules.
And remember that compassion and empathy, that feeling of being in another person’s place, when it’s time for you to be the reviewer.
-
Solving "Required kernel recording resources are in use by another document" in Instruments
So you have a Swift Package Manager project, without an xcodeproj, and you launch Instruments, and try to profile something (maybe Allocations), and you receive the message “Required kernel recording resources are in use by another document.” But of course you don’t have any other documents open in Instruments and you’re at a loss, so you’ve come here. Welcome.
(Everything here is from my own exploration and research over a few hours. It’s possible there are errors in my understanding of what’s going on, or there’s a better solution, in which case I’d love to hear from you so I can improve this post.)
First, this error message has nothing to do with the actual error. The real error is that your binary doesn’t have the
get-task-allowentitlement. I believe this is because it’s a release build, and SPM doesn’t distinguish between “release” and “profiling.” So you need to re-sign the binary.Edit your scheme (Cmd-Shift-,) and open the Profile>Pre-actions section. Add the following to re-sign prior to launching Instruments. Set your shell to
/bin/zsh(this won’t work with bash).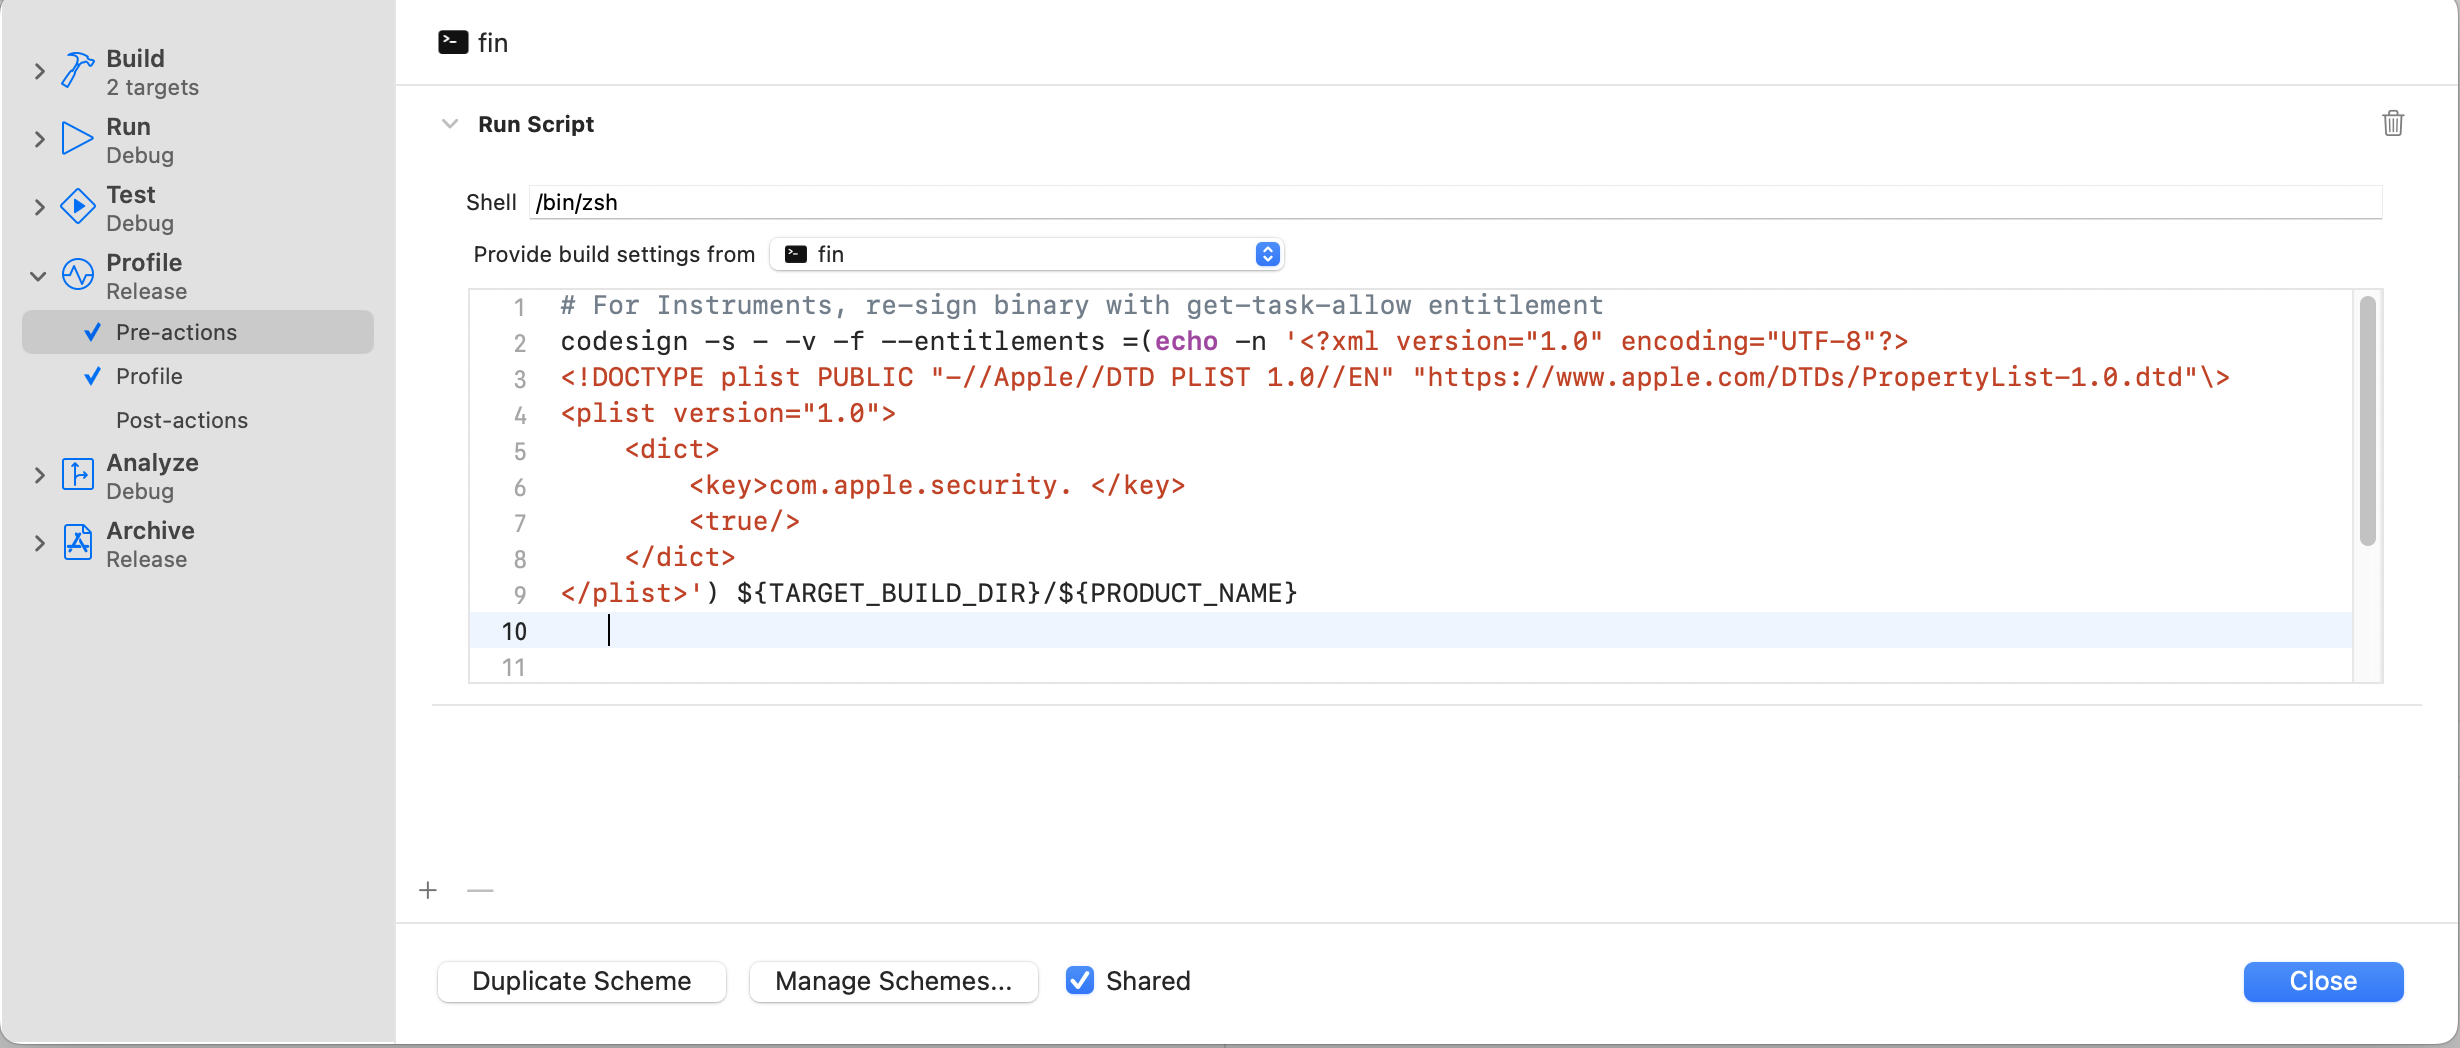
# For Instruments, re-sign binary with get-task-allow entitlement
codesign -s - -v -f --entitlements =(echo -n '<?xml version="1.0" encoding="UTF-8"?>
<!DOCTYPE plist PUBLIC "-//Apple//DTD PLIST 1.0//EN" "https://www.apple.com/DTDs/PropertyList-1.0.dtd"\>
<plist version="1.0">
    <dict>
        <key>com.apple.security.get-task-allow</key>
        <true/>
    </dict>
</plist>') ${TARGET_BUILD_DIR}/${PRODUCT_NAME}
The funny
=(...)syntax is a special zsh process subtitution that creates a temporary file containing the output of the command, and then uses that temporary file as the parameter. Note the-non the echo. It’s required that there be no trailing newline here.This script will be stored in
.swiftpm/xcode/xcshareddata/xcschemes/<schemename>.xcscheme.You might think you could just have a plist in your source directory and refer to it in this script, but pre-action scripts don’t know where the source code is. They don’t get SRCROOT.
Also beware that if there’s a problem in your pre-action script, you’ll get no information about it, and it won’t stop the build even if it fails. The output will be in Console.app, but other than that, it’s very silent.
So this is a mess of a solution, but I expect it to be pretty robust. It only applies to the Profile action, so it shouldn’t cause any problems with your production builds.
You can also switch over to using an xcodeproj, but… seriously? Who would do that?
subscribe via RSS