Externalizing properties to manage retains
I have a very simple type in my system. It’s just an immutable struct:
public struct AssetClass: Sendable, Equatable, Hashable, Comparable {
    public let name: String
    public let commodities: [String]
    public let returns: Rates

    public static func < (lhs: AssetClass, rhs: AssetClass) -> Bool {
        lhs.name < rhs.name
    }

    public static func == (lhs: AssetClass, rhs: AssetClass) -> Bool {
        lhs.name == rhs.name
    }

    public func hash(into hasher: inout Hasher) {
        hasher.combine(name)
    }
}
It has a unique name, a short array of symbols that are part of this asset class, and a couple of doubles that define the expected returns. My system uses this type a lot. In particular, it’s used in the rebalancing stage of monte carlo testing portfolios. There are only 5 values of this type in the system, but they are used tens of millions of times across 8 threads.
They’re value types. They’re immutable value types. So no problem. Except…
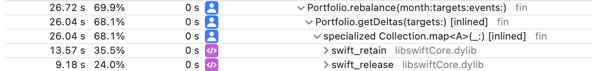
…
???
Yes, across all threads, swift_retain and swift_release in this one function represent over half of my run time (wall clock, that’s about 12 seconds; the times here count all threads).
But… structs. It’s all structs. Why? What?
Most Swift Collections (Array, String, Dictionary, etc.) in most cases store their contents on the heap in a reference-counted class. This is a key part of copy-on-write optimizations, and it’s usually a very good thing. But it means that copying the value, which happens many times when it’s passed to a function or captured into a closure, requires a retain and release. And those have to be atomic, which means there is a lock. And since this value is read on 8 threads all doing basically the same thing, there is a lot of contention on that lock, and the threads spend a lot of time waiting on each other just for reference counting.
In this case, none of the String values are a problem. Both the name and all the commodity symbols are short enough to fit in a SmallString (also lovingly called “smol” in the code). Those are inlined and don’t require heap storage.
But that commodities Array. It’s small. The largest has 5 elements, and the strings are all 5 bytes or less. But it’s on the heap, and that means reference counting. And it isn’t actually used anywhere in the rebalancing code. It’s only used when loading data. So what to do about it?
How about moving the data out of the struct and into a global map?
public struct AssetClass: Sendable, Equatable, Hashable, Comparable {

    // Global atomic map to hold commodity values, mapped to asset class names
    // All access to `commodities` is now done through .withLock
    private static var commodityMap = OSAllocatedUnfairLock<[String: [String]]>(initialState: [:])

    public init(name: String, commodities: [String], returns: Rates) {
        precondition(Self.commodityMap.withLock { $0[name] == nil },
                     "AssetClass names must be unique: \(name)")

        self.name = name
        Self.commodityMap.withLock { $0[name] = commodities }
        self.returns = returns
    }

    public let name: String
    public var commodities: [String] {
        Self.commodityMap.withLock { $0[name, default: []] }
    }
    public let returns: Rates
    // ...
And just like that, 30% performance improvement. Went from 12s to 8s.
This is a sometimes food. Do not go turning your structs inside out because Rob said it was faster. Measure, measure, measure. Fix your algorithms first. This slows down access to commodities, so if that were used a lot, this would be worse. And it relies on AssetClass being immutable. If there are setters, then you can get shared mutable state when you don’t expect it.
But…for this problem. Wow.
There’s more to do. Even after making this change, retain and release in this one function are still over 50% of all my runtime (it’s just a smaller runtime). But at least I have another tool for attacking it.
Oh, and how did I know what kinds of objects were being retained? Try this as a starting point:
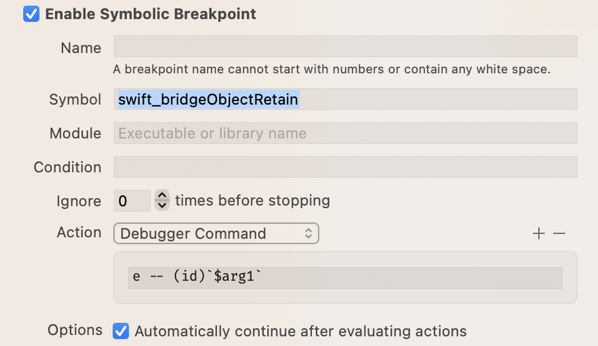
Be warned: this is a lot of output and very slow and the output is going to tell you about low-level types that may not have obvious correlation to your types, but it’s a starting point.
OK, back to Instruments. I should definitely be able to get this under 5 seconds.